Coinbase (COIN): Charting the Course Through Momentum and Volatility
Technical Analysis: The Current Landscape
Full disclosure: I am by no means a technical analyst. Frankly, when it comes to deciphering candlestick patterns and squiggly lines, I rely on a healthy dose of Perplexity to help make sense of the visual labyrinths that are trading charts. My preferred weapon of choice for chart generation is TradingView, replete with indicators that, if I’m honest, I’m still learning to properly pronounce, let alone interpret.
At times, these technical indicators can strike me as every bit as impenetrable as the intricate science of Hindu astrology, with its heavenly bodies allegedly capable of mapping out the destinies of eight billion souls. Do I place unwavering faith in such predictions? Hardly. But I’m equally short on reasons to outright dismiss them.
But I digress. For me, these analyses are less about cosmic certainty and more about stacking the odds in my favour, helping me spot those potentially opportune moments to either add to my investments or judiciously take money off the table.
If you’re pressed for time or simply prefer to absorb insights on the go, the NotebookLM-generated audio podcast of this thesis is the perfect solution. Instead of reading through the full analysis, you can listen to a concise, engaging summary that distils the key points, anecdotes, and implications for investors. Whether you’re commuting, at the gym, or multitasking, the podcast ensures you stay informed about Coinbase’s technical charts and its broader significance, no screen required. It’s a smart way to keep your finger on the pulse of crypto trends, even when your schedule is packed.
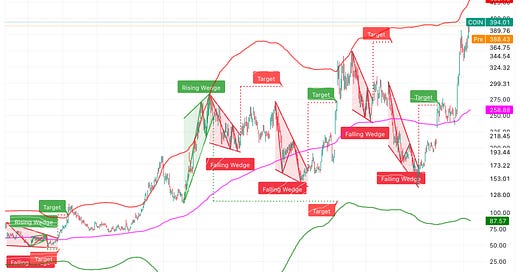
The attached chart reveals a fascinating technical narrative for Coinbase Global (COIN) as of July 2025. Trading at approximately $394, the stock demonstrates classic characteristics of a momentum-driven equity caught between powerful fundamental drivers and technical warning signals.
The chart showcases a series of rising and falling wedge patterns that have defined COIN’s price action throughout 2024 and into 2025. These wedge formations, particularly evident in the price structure, suggest periods of consolidation followed by explosive moves - a hallmark of highly volatile technology stocks in nascent sectors.
RSI: The Overbought Conundrum
The Relative Strength Index (RSI) currently sits at 71.83, firmly in overbought territory. This reading aligns with recent technical analysis suggesting that COIN has experienced sustained buying pressure that may be nearing exhaustion. However, the RSI’s behaviour in strong uptrends often defies conventional wisdom - stocks can remain overbought for extended periods during secular bull markets.
The RSI’s position above 70 traditionally signals caution, as it indicates that recent buying has been excessive and a correction may be imminent. Yet, for momentum stocks like COIN, RSI readings above 70 can persist, particularly when underlying fundamentals support continued institutional and retail interest.
Price Targets and Projections
Keep reading with a 7-day free trial
Subscribe to AlphaMonk by Satishan to keep reading this post and get 7 days of free access to the full post archives.


